Passenger ship · Bahamas flag · built 2011
SEABOURN QUEST: CO₂ emissions 2018–2024
IMO 9483126 EU ETS5 reporting years
- CO₂ reported 2024
- 9,708 t
- Fuel burned
- 3,074 t
- Time at sea
- 1,874 h
- Emitted at berth
- 11% of total
- Share of year under way
- 21%
- Gross tonnage
- 32,346
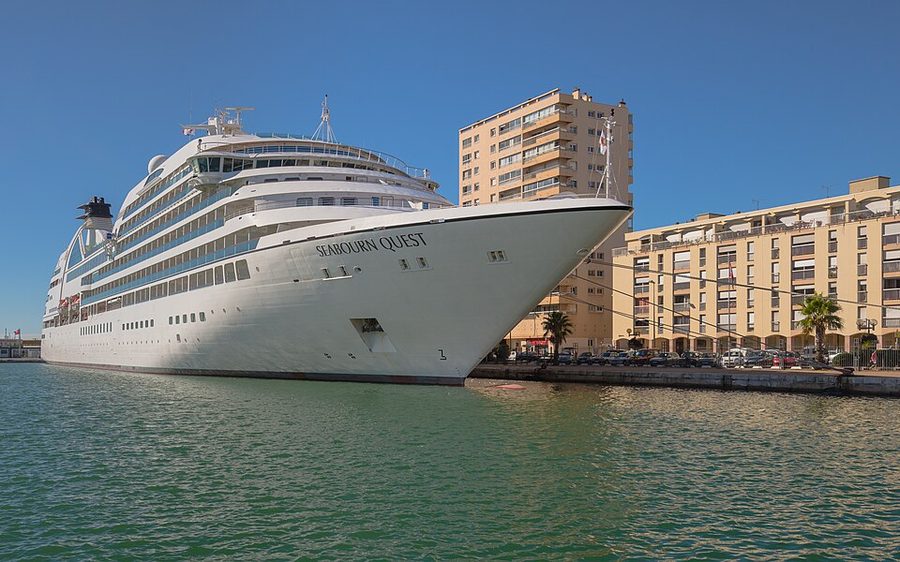

SEABOURN QUEST against its type
Built in 2011, it is 5 years newer than the median passenger ship on this register, which was built in 2006 (127 vessels with a known build year). At 32,346 gross tonnage it is smaller than 60% of the other 117 passenger ships with a recorded tonnage. It is one of 40 passenger ships here under the Bahamas flag, 30.3% of the 132 on the register. Seabourn Cruise Line is linked to 8 vessels on this register. The returns for 2018–2024 all give NASSAU as port of registry.
Its 9,708 t of CO₂ for 2024 is close to the median of 9,183 t among the 48 passenger ships on this register that reported for 2024. Per nautical mile it emitted 462.6 kg CO₂, close to the type median of 473.8 kg. It logged 1,874 hours at sea against a median of 1,874 hours for its type that year. 10.9% of its 2024 emissions were at berth; the median for passenger ships was 12.2%. Across 5 years with reported emissions, the highest was 2018 (12,336 t) and the lowest 2022 (8,243 t).
Emissions by year2018–2024
| Year | CO₂ (t) | Fuel (t) | Distance (nm) | At sea (h) | At berth (t) | kg CO₂/nm | EEOI | Percentile |
|---|---|---|---|---|---|---|---|---|
| 2024 | 9,708 | 3,074 | — | 1,874 | 1,059 | 462.6 | — | — |
| 2023 | 11,409 | 3,595 | — | 2,093 | 1,869 | 467.6 | — | — |
| 2022 | 8,243 | 2,571 | — | 1,381 | 859 | 516.2 | — | — |
| 2019 | 11,487 | 3,638 | — | 2,379 | 1,087 | 487.5 | — | — |
| 2018 | 12,336 | 3,902 | — | 2,645 | 822 | 705.3 | — | — |
Vessel particulars
- IMO number
- 9483126
- Ship type
- Passenger ship
- Gross tonnage
- 32,346
- Length overall
- 198.2 m
- Year built
- 2011
- Flag state
- Bahamas per EU MRV 2024
- Port of registry
- Nassau MRV 2024
- Technical efficiency (design)
- EEXI (13.8 gCO₂/t·nm)
- Operator
- Seabourn Cruise Line
- Verifier
- DNV, Germany
- Accreditation
- VS-16026-01
- Compliance document issued
- 2025-03-26
- Compliance document expires
- 2026-06-30
Reported CO₂ by year
Reported CO₂ in 2024 was 21.3% lower than in 2018, for EU/EEA voyages only. No return is recorded for 2020, 2021, so the series has gaps.
From 2023 to 2024, emissions fell 14.9% and CO₂ per nautical mile fell 1.1%.Distance is missing for at least one of the two years, so activity and efficiency cannot be separated here.
Where the 2024 emissions occurred
Methane, nitrous oxide and EU ETS2024
- Total CO₂ equivalent
- 9,859 t
- Methane (CH₄)
- 0.15 t
- Nitrous oxide (N₂O)
- 0.55 t
- Under EU ETS
- 6,656 t, 69% of total
Sources and how to read this
- Emissions: EU MRV publication (THETIS-MRV), reporting years 2018–2024, published by the European Commission.
- Vessel particulars: Wikidata (CC0) and Wikimedia Commons.
This page draws on 5 MRV reporting years, 4 of 5 vessel particulars and a licensed photograph. Not found in the sources for this vessel: an efficiency ranking, AIS movements in Norwegian waters, a name history, a sanctions listing and US port state inspections.
Empty means unreported, never zero. How EEOI, distance, percentiles and sister ships are handled is explained under reading a vessel page. Something wrong? See corrections.