Container ship · Malta flag · built 2018
CMA CGM ANTOINE DE SAINT EXUPERY: CO₂ emissions 2018–2025
IMO 9776418 EU ETS8 reporting years
- CO₂ reported 2025
- 72,718 t
- Fuel burned
- 23,320 t
- Distance
- 73,946 nm
- Time at sea
- 4,972 h
- Emitted at berth
- 3% of total
- Share of year under way
- 57%
- Gross tonnage
- 217,673
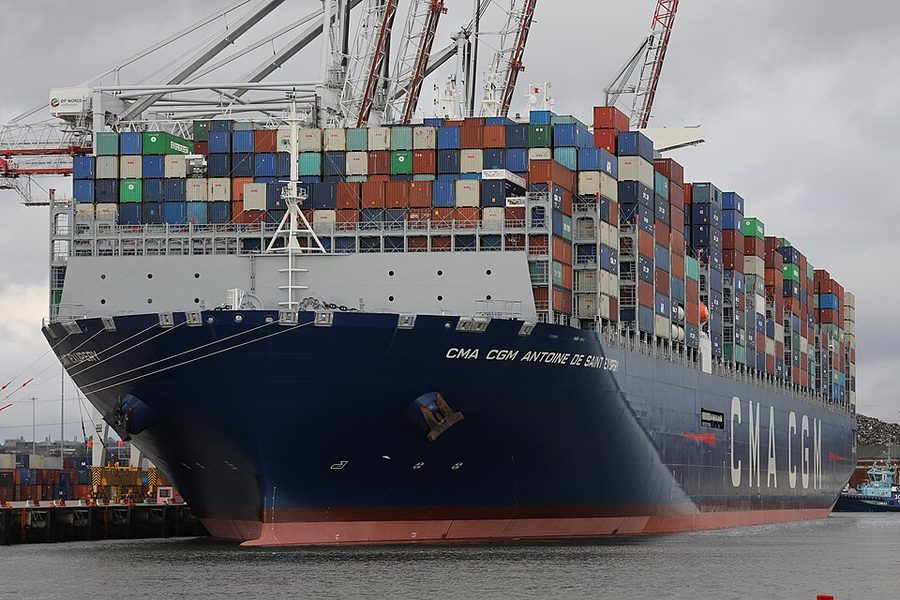

CMA CGM ANTOINE DE SAINT EXUPERY against its type
Built in 2018, it is 10 years newer than the median container ship on this register, which was built in 2008 (3,088 vessels with a known build year). At 217,673 gross tonnage it is larger than 98% of the other 3,000 container ships with a recorded tonnage. It is one of 336 container ships here under the Malta flag, 9.6% of the 3,495 on the register. The same builder is recorded for 74 other vessels here, 49 of them container ships. The reported port of registry changed: Marseille (2018–2020), then Valetta (2021–2025).
Its 72,718 t of CO₂ for 2025 is 4.4 times the median of 16,359 t among the 2,234 container ships on this register that reported for 2025. Per nautical mile it emitted 983.4 kg CO₂, 1.8 times the type median of 545.6 kg. It logged 4,972 hours at sea against a median of 3,155 hours for its type that year. 2.9% of its 2025 emissions were at berth; the median for container ships was 3.2%. Across 8 years with reported emissions, the highest was 2024 (90,102 t) and the lowest 2019 (48,496 t). Its efficiency percentile within the type went from 1 in 2018 to 9 in 2025 (lower is more efficient). Of the 5 sister ships listed below with a 2025 return, 5 reported a lower CO₂ per nautical mile than this vessel.
Emissions by year2018–2025
| Year | CO₂ (t) | Fuel (t) | Distance (nm) | At sea (h) | At berth (t) | kg CO₂/nm | EEOI | Percentile |
|---|---|---|---|---|---|---|---|---|
| 2025 | 72,718 | 23,320 | 73,946 | 4,972 | 2,132 | 983.4 | 6.8 | 9 |
| 2024 | 90,102 | 28,911 | 89,943 | 5,447 | 2,185 | 1,001.8 | 7.4 | 13 |
| 2023 | 49,870 | 15,991 | 54,600 | 3,790 | 1,967 | 913.4 | 6.3 | 5 |
| 2022 | 57,979 | 18,546 | 56,555 | 4,060 | 2,008 | 1,025.2 | 4.1 | 0 |
| 2021 | 84,260 | 26,945 | 71,805 | 4,671 | 3,162 | 1,173.5 | 6.5 | 7 |
| 2020 | 71,911 | 22,927 | 62,025 | 3,863 | 2,244 | 1,159.4 | 5.7 | 2 |
| 2019 | 48,496 | 15,550 | 48,648 | 2,927 | 1,124 | 996.9 | 4.9 | 0 |
| 2018 | 69,892 | 22,398 | 63,684 | 3,448 | 2,298 | 1,097.5 | 6.3 | 1 |
Vessel particulars
- IMO number
- 9776418
- Ship type
- Container ship
- Gross tonnage
- 217,673
- Length overall
- 400.0 m
- Year built
- 2018
- Flag state
- Malta per EU MRV 2025
Sources disagree: Wikidata/AIS (undated) list France. The flag shown is from the newest official source, the EU MRV return for 2025. - Builder
- HHIC Phil
- Port of registry
- Valetta MRV 2025
- Technical efficiency (design)
- EEXI (7.84 gCO₂/t·nm)
- Verifier
- AMERICAN BUREAU OF SHIPPING HELLENIC SINGLE MEMBER LIMITED LIABILITY COMPANY (ABS HELLENIC S.M. LTD), Greece
- Accreditation
- 1083-2
- Compliance document issued
- 2026-04-01
- Compliance document expires
- 2027-06-30
Efficiency against its own type2025
Position 167 of 1,838 qualifying container ships by EEOI, at the 9th percentile. The dashed line is the type median, 14.2; this vessel reported 6.8.
EEOI divides emissions by transport work, which for this vessel and year was 10,615,816,058 tonne-miles over 73,946 nautical miles.
Reported CO₂ by year
Reported CO₂ in 2025 was 4.0% higher than in 2018, for EU/EEA voyages only.
From 2024 to 2025, emissions fell 19.3% while distance sailed fell 17.8%and CO₂ per nautical mile fell 1.8%.That points mainly to how much the vessel sailed, rather than the other.
Where the 2025 emissions occurred
Methane, nitrous oxide and EU ETS2025
- Total CO₂ equivalent
- 73,863 t
- Methane (CH₄)
- 1.17 t
- Nitrous oxide (N₂O)
- 4.20 t
- Under EU ETS
- 40,079 t, 55% of total
Laden voyages2025
- CO₂ on laden voyages
- 70,586 t, 97% of total
- Fuel, laden
- 22,654 t
- CO₂ per nm, laden
- 954.6 kg
The rest of the 2025 total was emitted on ballast legs or at berth.
Sources and how to read this
- Emissions: EU MRV publication (THETIS-MRV), reporting years 2018–2025, published by the European Commission.
- Vessel particulars: Wikidata (CC0) and Wikimedia Commons.
This page draws on 8 MRV reporting years, an efficiency ranking, 5 of 5 vessel particulars and a licensed photograph. Not found in the sources for this vessel: AIS movements in Norwegian waters, a name history, a sanctions listing and US port state inspections.
Empty means unreported, never zero. How EEOI, distance, percentiles and sister ships are handled is explained under reading a vessel page. Something wrong? See corrections.