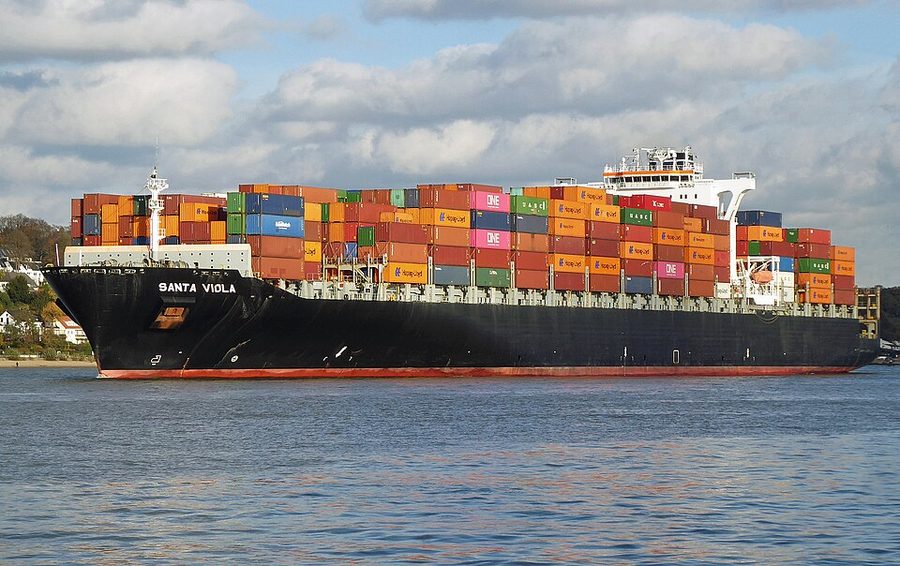
Container ship · Malta flag · built 2005
SANTA VIOLA: CO₂ emissions 2018–2025
IMO 9295373 EU ETS8 reporting years
- CO₂ reported 2025
- 13,993 t
- Fuel burned
- 4,472 t
- Distance
- 23,421 nm
- Time at sea
- 1,677 h
- Emitted at berth
- 3% of total
- Share of year under way
- 19%
- Gross tonnage
- 65,483
.jpg)
Emissions by year2018–2025
| Year | CO₂ (t) | Fuel (t) | Distance (nm) | At sea (h) | At berth (t) | kg CO₂/nm | EEOI | Percentile |
|---|---|---|---|---|---|---|---|---|
| 2025 | 13,993 | 4,472 | 23,421 | 1,677 | 403 | 597.5 | 17.4 | 61 |
| 2024 | 23,335 | 7,469 | 34,463 | 2,349 | 989 | 677.1 | 15.9 | 52 |
| 2023 | 36,816 | 11,811 | 58,715 | 3,853 | 748 | 627.0 | 14.9 | 43 |
| 2022 | 56,112 | 17,993 | 80,610 | 5,146 | 1,023 | 696.1 | 15.2 | 44 |
| 2021 | 57,616 | 18,446 | 82,864 | 4,874 | 1,155 | 695.3 | 16.5 | 51 |
| 2020 | 32,636 | 10,471 | 52,668 | 3,632 | 963 | 619.7 | 14.3 | 44 |
| 2019 | 39,298 | 12,593 | 66,204 | 4,704 | 2,149 | 593.6 | 14.2 | 37 |
| 2018 | 9,703 | 3,114 | 17,084 | 2,768 | 280 | 567.9 | 27.3 | 71 |
Vessel particulars
- IMO number
- 9295373
- Ship type
- Container ship
- Gross tonnage
- 65,483
- Length overall
- 274.7 m
- Year built
- 2005
- Flag state
- Malta per EU MRV 2025
- Builder
- HD Hyundai Samho
- Port of registry
- Valletta MRV 2025
- Technical efficiency (design)
- EEXI (12.08 gCO₂/t·nm)
- Operator
- CPO Containerschiffreederei
- Verifier
- DNV, Germany
- Accreditation
- VS-16026-01
- Compliance document issued
- 2026-02-18
- Compliance document expires
- 2027-06-30
Flag state is derived from the reported port of registry, not reported directly, and reflects the registry at the time of reporting.
Efficiency against its own type2025
Position 1,128 of 1,838 qualifying container ships by EEOI, at the 61th percentile. The dashed line is the type median, 14.2; this vessel reported 17.4.
Across the 54 ranked vessels operated by CPO Containerschiffreederei, the median percentile is 48. This vessel is less efficient than its own fleet median.
EEOI divides emissions by transport work, which for this vessel and year was 803,748,420 tonne-miles over 23,421 nautical miles.
Reported CO₂ by year
Reported CO₂ in 2025 was 44.2% higher than in 2018. EU MRV only covers voyages to, from and within the EU/EEA, so a change can reflect where the vessel sailed as much as how much it emitted.
From 2024 to 2025, emissions fell 40.0% while distance sailed fell 32.0%and CO₂ per nautical mile fell 11.8%.That points mainly to how much the vessel sailed, rather than the other.
Where the 2025 emissions occurred
Methane, nitrous oxide and EU ETS2025
- Total CO₂ equivalent
- 14,213 t
- Methane (CH₄)
- 0.22 t
- Nitrous oxide (N₂O)
- 0.80 t
- Under EU ETS
- 8,069 t, 58% of total
Sources and how to read this
- Emissions: EU MRV publication (THETIS-MRV), reporting years 2018–2025, published by the European Commission.
- Vessel particulars: Wikidata (CC0) and Wikimedia Commons.
What this page is built on
- Reporting years
- 8
- Ranked by efficiency
- yes
- Vessel particulars
- 5 of 5
- Movement data
- not observed
- Name history
- none recorded
- Photograph
- yes
- Sanctions record
- none
- Inspection record
- none in US waters
Caveats that apply to every vessel page
EEOI above 100,000 is withheld. Those values come from returns where reported transport work is near zero, which makes the ratio meaningless rather than extreme. Median across the dataset is around 12.
Emission categories overlap. In the MRV return, emissions at berth are also counted inside the voyage legs, so the categories do not sum to the total. They are shown side by side rather than stacked for that reason.
Distance is derived, intensity is reported. The MRV return publishes CO₂ per nautical mile but not the distance itself, which is null in all 106,564 rows of the source. The distance column is therefore filled from the ranking step, which reconstructs it, and is blank for years where a vessel was not ranked. That is why a row can show an intensity without a distance.
Percentile is within type and year. It is the vessel's position among qualifying ships of the same type that year, where lower is more efficient. A blank means the vessel did not qualify for ranking that year.
Sister ships share a builder, a type and a build year within two years of this vessel. That holds hull and machinery roughly constant and leaves operation as the variable, which is why they are listed before nearest-by-tonnage.
Methane and nitrous oxide start in 2024. They were not reported before that period, so earlier years cannot be compared against them.
Technical efficiency is a design figure fixed at construction. A vessel can hold a good index and still emit heavily by sailing fast, waiting at anchor or carrying little.
Inspection records cover United States waters only. An empty record is not evidence of a clean history elsewhere.
Empty means unreported, never zero. Nothing here is modelled, estimated or interpolated. See the methodology.
Something wrong on this page? See corrections. We do not hold the source registers and cannot amend them, but we will fix anything we have got wrong in reproducing them.