Bulk carrier · Panama flag · built 2019
PACIFIC MYRA: CO₂ emissions 2019–2025
IMO 9835898 EU ETS6 reporting years
- CO₂ reported 2025
- 7,720 t
- Fuel burned
- 2,470 t
- Distance
- 17,371 nm
- Time at sea
- 1,606 h
- Emitted at berth
- 1% of total
- Share of year under way
- 18%
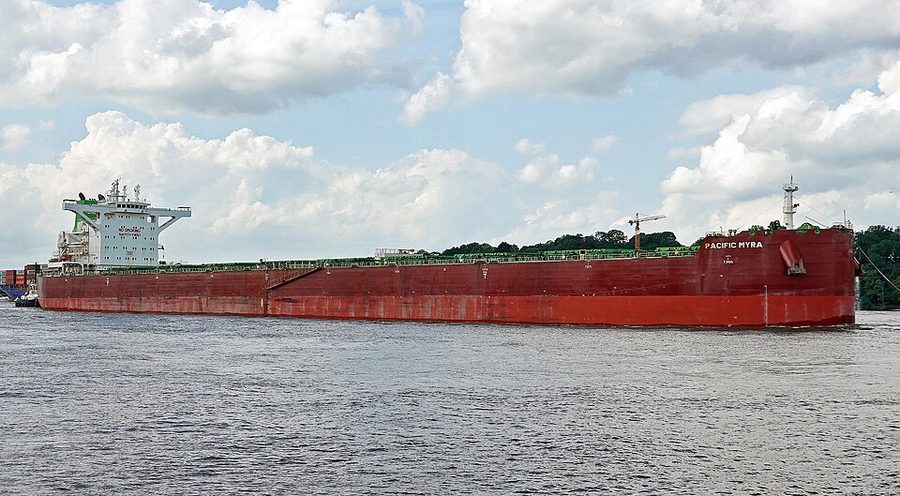

PACIFIC MYRA against its type
Built in 2019, it is 7 years newer than the median bulk carrier on this register, which was built in 2012 (6,882 vessels with a known build year). It is one of 1,601 bulk carriers here under the Panama flag, 19.7% of the 8,138 on the register. The same builder is recorded for 211 other vessels here, 129 of them bulk carriers. The reported port of registry changed: PANAMA (2019–2021), then SINGAPORE (2022–2023), then Panama (2025).
Its 7,720 t of CO₂ for 2025 is 2.4 times the median of 3,239 t among the 3,731 bulk carriers on this register that reported for 2025. Per nautical mile it emitted 444.4 kg CO₂, 1.7 times the type median of 260.7 kg. It logged 1,606 hours at sea against a median of 1,200 hours for its type that year. 1.3% of its 2025 emissions were at berth; the median for bulk carriers was 3.7%. Across 6 years with reported emissions, the highest was 2021 (12,090 t) and the lowest 2022 (3,849 t). Its efficiency percentile within the type went from 14 in 2019 to 2 in 2025 (lower is more efficient). Of the 7 sister ships listed below with a 2025 return, 7 reported a lower CO₂ per nautical mile than this vessel.
Emissions by year2019–2025
| Year | CO₂ (t) | Fuel (t) | Distance (nm) | At sea (h) | At berth (t) | kg CO₂/nm | EEOI | Percentile |
|---|---|---|---|---|---|---|---|---|
| 2025 | 7,720 | 2,470 | 17,371 | 1,606 | 99 | 444.4 | 3.1 | 2 |
| 2023 | 6,238 | 1,976 | 15,057 | 1,338 | 344 | 414.3 | 3.0 | 1 |
| 2022 | 3,849 | 1,233 | 8,878 | 821 | 46 | 433.6 | 2.9 | 1 |
| 2021 | 12,090 | 3,834 | 27,251 | 2,122 | 451 | 443.6 | 3.1 | 1 |
| 2020 | 11,794 | 3,773 | 25,870 | 2,181 | 442 | 455.9 | 3.7 | 3 |
| 2019 | 4,374 | 1,404 | 9,564 | 819 | 70 | 457.3 | 5.3 | 14 |
Vessel particulars
- IMO number
- 9835898
- Ship type
- Bulk carrier
- Length overall
- 291.5 m
- Year built
- 2019
- Flag state
- Panama per EU MRV 2025
- Port of registry
- Panama MRV 2025
- Home port
- Panama
- Technical efficiency (design)
- EEDI (2.41 gCO₂/t·nm)
- Verifier
- Nippon Kaiji Kyokai, Japan
- Accreditation
- VS-21325-01
- Compliance document issued
- 2026-03-13
- Compliance document expires
- 2027-06-30
Efficiency against its own type2025
Position 49 of 3,241 qualifying bulk carriers by EEOI, at the 2nd percentile. The dashed line is the type median, 7.6; this vessel reported 3.1.
EEOI divides emissions by transport work, which for this vessel and year was 2,458,445,860 tonne-miles over 17,371 nautical miles.
Reported CO₂ by year
Reported CO₂ in 2025 was 76.5% higher than in 2019, for EU/EEA voyages only. No return is recorded for 2024, so the series has gaps.
From 2023 to 2025, emissions rose 23.8% while distance sailed rose 15.4%and CO₂ per nautical mile rose 7.3%.That points mainly to how much the vessel sailed, rather than the other.
Where the 2025 emissions occurred
Methane, nitrous oxide and EU ETS2025
- Total CO₂ equivalent
- 7,841 t
- Methane (CH₄)
- 0.12 t
- Nitrous oxide (N₂O)
- 0.44 t
- Under EU ETS
- 3,984 t, 52% of total
Sources and how to read this
- Emissions: EU MRV publication (THETIS-MRV), reporting years 2019–2025, published by the European Commission.
- Vessel particulars: Wikidata (CC0) and Wikimedia Commons.
This page draws on 6 MRV reporting years, an efficiency ranking, 4 of 5 vessel particulars and a licensed photograph. Not found in the sources for this vessel: AIS movements in Norwegian waters, a name history, a sanctions listing and US port state inspections.
Empty means unreported, never zero. How EEOI, distance, percentiles and sister ships are handled is explained under reading a vessel page. Something wrong? See corrections.