Bulk carrier · Marshall Islands flag · built 2013
AM ANNABA: CO₂ emissions 2018–2025
IMO 9669330 EU ETS8 reporting years
- CO₂ reported 2025
- 6,705 t
- Fuel burned
- 2,127 t
- Distance
- 21,755 nm
- Time at sea
- 2,440 h
- Emitted at berth
- 4% of total
- Share of year under way
- 28%
- Gross tonnage
- 41,254
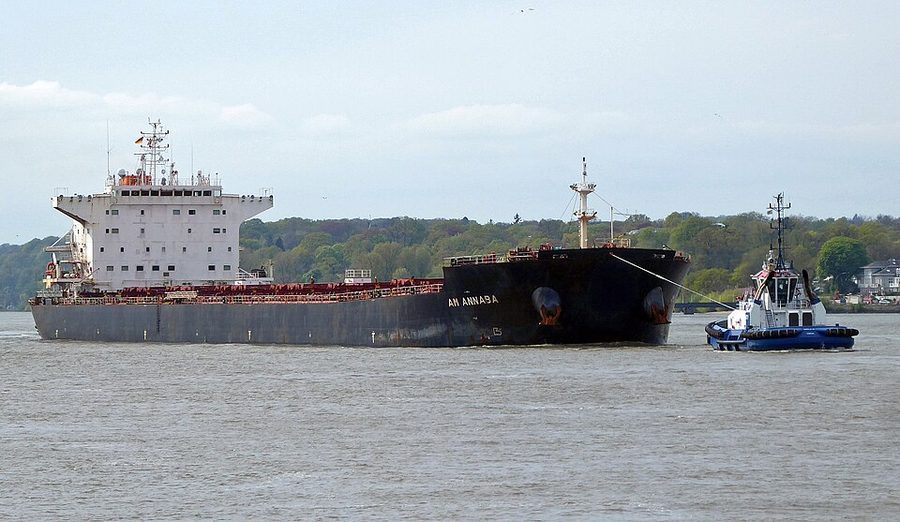

AM ANNABA against its type
Built in 2013, it is 1 year newer than the median bulk carrier on this register, which was built in 2012 (6,882 vessels with a known build year). At 41,254 gross tonnage it is larger than 65% of the other 6,571 bulk carriers with a recorded tonnage. It is one of 1,603 bulk carriers here under the Marshall Islands flag, 19.7% of the 8,138 on the register. The same builder is recorded for 204 other vessels here, 70 of them bulk carriers. Anglo-Eastern Ship Management is linked to 133 vessels on this register. Its MRV returns name it AM ANNABA for 2018–2024 and XIN HAI TONG 808 for 2025. The returns for 2018–2025 all give Majuro as port of registry.
Its 6,705 t of CO₂ for 2025 is 2.1 times the median of 3,238 t among the 3,732 bulk carriers on this register that reported for 2025. Per nautical mile it emitted 308.2 kg CO₂, 18% above the type median of 260.7 kg. It logged 2,440 hours at sea against a median of 1,199 hours for its type that year. 3.9% of its 2025 emissions were at berth; the median for bulk carriers was 3.7%. Across 8 years with reported emissions, the highest was 2022 (16,429 t) and the lowest 2023 (4,522 t). Its efficiency percentile within the type went from 88 in 2018 to 56 in 2025 (lower is more efficient). Of the 2 sister ships listed below with a 2025 return, 1 reported a lower CO₂ per nautical mile than this vessel.
Emissions by year2018–2025
| Year | CO₂ (t) | Fuel (t) | Distance (nm) | At sea (h) | At berth (t) | kg CO₂/nm | EEOI | Percentile |
|---|---|---|---|---|---|---|---|---|
| 2025 | 6,705 | 2,127 | 21,755 | 2,440 | 263 | 308.2 | 8.0 | 56 |
| 2024 | 9,535 | 3,040 | 33,978 | 3,475 | 270 | 280.6 | 5.8 | 22 |
| 2023 | 4,522 | 1,440 | 15,077 | 1,535 | 135 | 299.9 | 8.8 | 60 |
| 2022 | 16,429 | 5,183 | 50,308 | 4,794 | 515 | 326.6 | 9.4 | 62 |
| 2021 | 12,327 | 3,893 | 37,526 | 3,589 | 469 | 328.5 | 7.1 | 32 |
| 2020 | 8,269 | 2,605 | 28,525 | 2,928 | 552 | 289.9 | 7.7 | 45 |
| 2019 | 15,589 | 4,944 | 54,765 | 7,219 | 429 | 284.7 | 7.8 | 46 |
| 2018 | 8,948 | 2,850 | 28,383 | 2,683 | 200 | 315.3 | 13.2 | 88 |
Vessel particulars
- IMO number
- 9669330
- Previously reported as
- XIN HAI TONG 808
- Ship type
- Bulk carrier
- Gross tonnage
- 41,254
- Length overall
- 225.0 m
- Year built
- 2013
- Flag state
- Marshall Islands per EU MRV 2025
- Builder
- Hudong-Zhonghua Shipbuilding
- Port of registry
- Majuro MRV 2025
- Home port
- Majuro
- Technical efficiency (design)
- EEXI (3.61 gCO₂/t·nm)
- Operator
- Anglo-Eastern Ship Management
- Verifier
- CHINA CLASSIFICATION SOCIETY, China
- Accreditation
- 0003VV
- Compliance document issued
- 2026-03-28
- Compliance document expires
- 2027-06-30
Efficiency against its own type2025
Position 1,812 of 3,241 qualifying bulk carriers by EEOI, at the 56th percentile. The dashed line is the type median, 7.6; this vessel reported 8.0.
Across the 102 ranked vessels operated by Anglo-Eastern Ship Management, the median percentile is 55. This vessel is less efficient than its own fleet median.
EEOI divides emissions by transport work, which for this vessel and year was 835,983,790 tonne-miles over 21,755 nautical miles.
Reported CO₂ by year
Reported CO₂ in 2025 was 25.1% lower than in 2018, for EU/EEA voyages only.
From 2024 to 2025, emissions fell 29.7% while distance sailed fell 36.0%and CO₂ per nautical mile rose 9.8%.That points mainly to how much the vessel sailed, rather than the other.
Where the 2025 emissions occurred
Methane, nitrous oxide and EU ETS2025
- Total CO₂ equivalent
- 6,809 t
- Methane (CH₄)
- 0.11 t
- Nitrous oxide (N₂O)
- 0.38 t
- Under EU ETS
- 159 t, 2% of total
Laden voyages2025
- CO₂ on laden voyages
- 3,460 t, 52% of total
- Fuel, laden
- 1,101 t
- CO₂ per nm, laden
- 287.1 kg
The rest of the 2025 total was emitted on ballast legs or at berth.
Verifier history
| From reporting year | Verifier | Accredited in |
|---|---|---|
| 2018 | AMERICAN BUREAU OF SHIPPING HELLENIC SINGLE MEMBER LIMITED LIABILITY COMPANY (ABS HELLENIC S.M. LTD) | Greece |
| 2025 | CHINA CLASSIFICATION SOCIETY | China |
A change of verifier is not in itself a sign of anything being wrong.
Sources and how to read this
- Emissions: EU MRV publication (THETIS-MRV), reporting years 2018–2025, published by the European Commission.
- Vessel particulars: Wikidata (CC0) and Wikimedia Commons.
This page draws on 8 MRV reporting years, an efficiency ranking, 5 of 5 vessel particulars, a name history and a licensed photograph. Not found in the sources for this vessel: AIS movements in Norwegian waters, a sanctions listing and US port state inspections.
Empty means unreported, never zero. How EEOI, distance, percentiles and sister ships are handled is explained under reading a vessel page. Something wrong? See corrections.